Multiple Choice
The figure shows a graph of the resistance of a wire as a function of its length. What physical quantities does the slope of this graph represent? 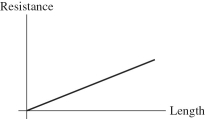
A) the cross-sectional area of the wire
B) the resistivity of the material of which the wire is made
C) the product of the resistivity and the cross-sectional area of the wire
D) the resistivity of the material divided by the cross-sectional area of the wire
E) the reciprocal of the resistivity of the material
Correct Answer:

Verified
Correct Answer:
Verified
Q17: A 1.0-mm diameter extension cord is made
Q19: A light bulb operating at a dc
Q37: What is the resistance of 1.0 m
Q87: A tube of mercury with resistivity 9.84
Q108: If a quantity you calculated has units
Q126: The length of a certain wire is
Q131: A light bulb operating at a dc
Q149: The length of a certain wire is
Q198: A battery is rated at 12 V
Q209: Which one of the following quantities is