Essay
Given the following graphic: 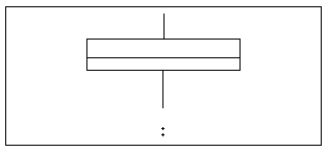 A)What do the asterisks (*)represent?
B)What does the line in the middle of the box represent?
Correct Answer:

Verified
The asterisks repres...View Answer
Unlock this answer now
Get Access to more Verified Answers free of charge
Correct Answer:
Verified
The asterisks repres...
View Answer
Unlock this answer now
Get Access to more Verified Answers free of charge
Related Questions
Q91: A sample of 15 observations has a
Q92: The numerical value of the coefficient of
Q93: Find the midrange for the following data:
Q94: Salaries<br>The salaries (in thousands of dollars)for a
Q95: In a given data sample,the mean is
Q97: When a distribution has more values to
Q98: What is the coefficient of variation of
Q99: The difference between the largest and smallest
Q100: Expressed in percentiles,the interquartile range is the
Q101: Which of the following statements is true