Essay
Identify the distribution shown in the following graph.Indicate the approximate areas that will lie beneath the curve for the intervals shown. 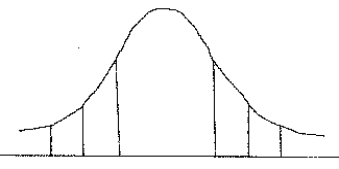
Correct Answer:

Verified
Correct Answer:
Verified
Related Questions
Q150: A salesman who uses his car extensively
Q151: The average labor time to sew a
Q152: Given that z is a standard normal
Q153: In any normal distribution,the mean,median,mode,and standard deviation
Q154: Scores of high school students on a
Q155: The average waiting time at the checkout
Q157: If the area to the right of
Q158: Women make up 58% of the U.S.civilian
Q159: Using the standard normal table,the total area
Q160: Computer statistical packages,such as Excel and Minitab,can