Short Answer
Tail graph 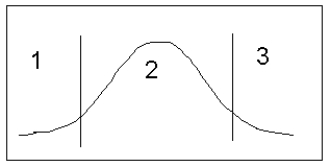
-Using the above graph,choose the answers that indicate a right-tail test:
Area 1: ____________________
Area 2: ____________________
Area 3: ____________________
Correct Answer:

Verified
Do not rej...View Answer
Unlock this answer now
Get Access to more Verified Answers free of charge
Correct Answer:
Verified
View Answer
Unlock this answer now
Get Access to more Verified Answers free of charge
Q8: Adult drink<br>A particular study claims that
Q14: General Manager<br>The general manager of a
Q16: Local Restaurant<br>A local restaurant claimed in
Q17: General Manager<br>The general manager of a large
Q19: Golf<br>A round of golf on your
Q20: A portfolio manager was analyzing the
Q21: A portfolio manager was analyzing the price-earnings
Q23: In testing H0: <span class="ql-formula"
Q74: County Agricultural<br>A county agricultural analyst took a
Q79: THE NEXT QUESTIONS ARE BASED ON THE