Short Answer
Tail graph 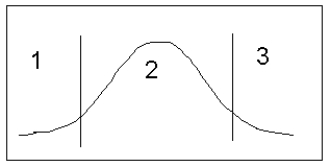
-Using the above graph,choose the answers that indicate a two-tail test:
Area 1: ____________________
Area 2: ____________________
Area 3: ____________________
Correct Answer:

Verified
Reject H0; ...View Answer
Unlock this answer now
Get Access to more Verified Answers free of charge
Correct Answer:
Verified
View Answer
Unlock this answer now
Get Access to more Verified Answers free of charge
Q74: County Agricultural<br>A county agricultural analyst took a
Q75: A social scientist claims that the average
Q76: General Manager<br>The general manager of a large
Q77: The power of a test is the
Q79: A portfolio manager was analyzing the price-earnings
Q80: Soft drink<br>A soft drink dispenser is set
Q81: Consider testing the hypotheses H<sub>0</sub>:
Q82: A filling machine is designed to
Q83: If we do not reject the null
Q138: Adult drink<br>A particular study claims that