Multiple Choice
Figure 2.1
Every second semester, the School of Business at a large university coordinates with local business leaders at a luncheon for graduating students, their families, and friends. Corporate sponsorship pays for the lunches of each of the graduating students, but students have to purchase tickets to cover the cost of lunches served to guests they bring with them. The following histogram represents the attendance at the luncheon, where X is the number of guests each graduating student invited to the luncheon and f is the number of graduating students in each category. 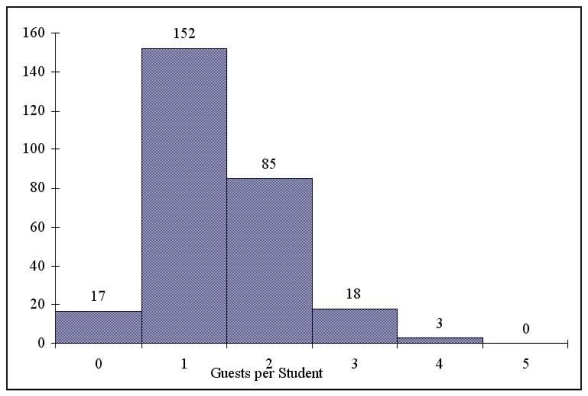
-Referring to the histogram from Figure 2.1,how many graduating students attended the luncheon?
A) 388
B) 275
C) 4
D) 152
Correct Answer:

Verified
Correct Answer:
Verified
Q62: Instruction 2.3<br>A survey was conducted to
Q62: The width of each bar in a
Q63: Instruction 2.11<br>The table below contains the
Q64: Any two-dimensional graph should contain a _for
Q65: Instruction 2.2<br>At a meeting of information
Q66: Instruction 2.7<br>The ordered array below resulted
Q68: Instruction 2.9<br>A sample of 200 students
Q70: In a contingency table,the number of rows
Q71: Instruction 2.8<br>Given below is the stem-and-leaf
Q72: In general,grouped frequency distributions should have between