Short Answer
Figure 2.2
The histogram below represents scores achieved by 200 job applicants on a personality profile. 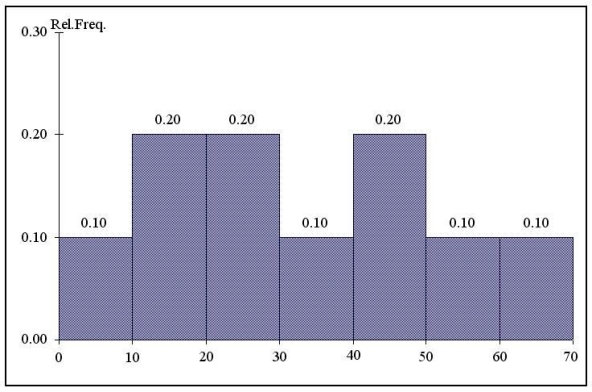
-Referring to the histogram from Figure 2.2,_________ %t of the job applicants scored below 50.
Correct Answer:

Verified
Correct Answer:
Verified
Related Questions
Q19: Instruction 2.4<br>The following are the durations
Q20: Figure 2.2<br>The histogram below represents scores achieved
Q21: Arnold would like to view up-to-the-minute operational
Q22: An economist is evaluating the relationship between
Q23: You have collected data on the number
Q25: Which one of the following is not
Q26: Instruction 2.11<br>The table below contains the
Q27: Which form of analytics focuses on the
Q28: Instruction 2.10<br>The table below contains the
Q29: Instruction 2.8<br>Given below is the stem-and-leaf