Short Answer
Figure 2.2
The histogram below represents scores achieved by 200 job applicants on a personality profile. 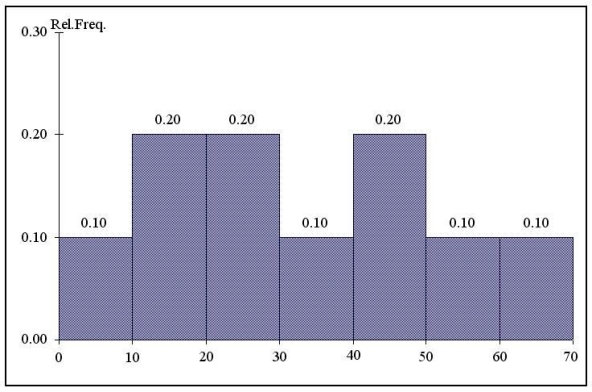
-Referring to the histogram from Figure 2.2,the number of job applicants who scored between 30 and below 60 is _________.
Correct Answer:

Verified
Correct Answer:
Verified
Q37: If you wish to construct a graph
Q116: Instruction 2.11<br>The table below contains the
Q117: Instruction 2.5<br>The Stem-and-Leaf display below contains
Q118: Given below is the scatter plot of
Q119: Instruction 2.10<br>The table below contains the
Q123: Instruction 2.9<br>A sample of 200 students
Q124: Instruction 2.3<br>A survey was conducted to
Q125: You have collected information on the market
Q126: Instruction 2.5<br>The Stem-and-Leaf display below contains
Q162: One of the advantages of a pie