Short Answer
Figure 2.2
The histogram below represents scores achieved by 200 job applicants on a personality profile. 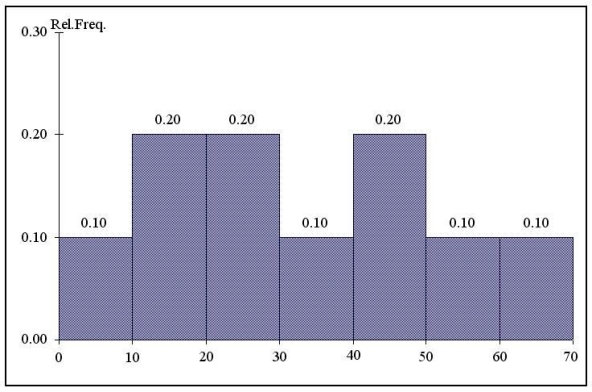
-Referring to the histogram from Figure 2.2,the number of job applicants who scored 50 or above is _________.
Correct Answer:

Verified
Correct Answer:
Verified
Q72: Percentage polygons are plotted at the boundaries
Q100: In general,a frequency distribution should have at
Q103: Instruction 2.3<br>A survey was conducted to
Q104: Instruction 2.5<br>The Stem-and-Leaf display below contains
Q106: Instruction 2.6<br>The frequency distribution below represents
Q107: A marketing analyst is evaluating the effectiveness
Q108: A bar chart cannot have gaps between
Q109: Instruction 2.8<br>Given below is the stem-and-leaf
Q110: When studying the simultaneous responses to two
Q161: A side-by-side chart is two histograms plotted