Short Answer
Figure 2.2
The histogram below represents scores achieved by 200 job applicants on a personality profile. 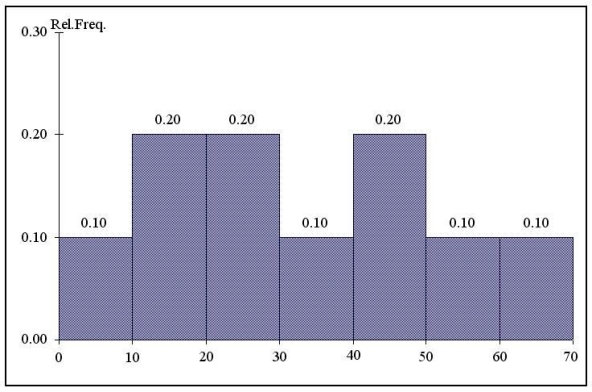
-Referring to the histogram from Figure 2.2,90% of the job applicants scored above or equal to _________.
Correct Answer:

Verified
Correct Answer:
Verified
Related Questions
Q76: Figure 2.2<br>The histogram below represents scores achieved
Q77: A contingency table is also referred to
Q78: A research analyst was directed to arrange
Q79: Retailers are always interested in determining why
Q80: _analytics investigates what should occur and prescribes
Q83: Instruction 2.7<br>The ordered array below resulted
Q84: A _is a summary table in which
Q85: Relationships in a contingency table can be
Q86: The percentage polygon is formed by having
Q86: Data on the number of credit hours