Short Answer
Figure 2.2
The histogram below represents scores achieved by 200 job applicants on a personality profile. 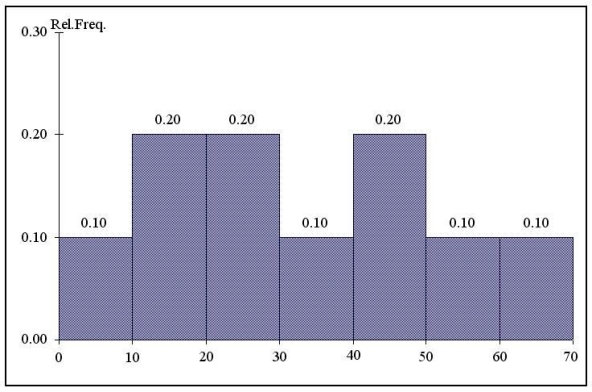
-Referring to the histogram from Figure 2.2,_________ % of the applicants scored below 20 or at least 50.
Correct Answer:

Verified
Correct Answer:
Verified
Related Questions
Q179: You have collected data on the approximate
Q180: Instruction 2.4<br>The following are the durations
Q181: Instruction 2.9<br>A sample of 200 students
Q182: A scatter diagram can be used to
Q183: When studying the simultaneous responses to two
Q185: You have collected data on the responses
Q186: Instruction 2.11<br>The table below contains the
Q187: Facebook collected information on the age of
Q188: The point halfway between the boundaries of
Q189: Instruction 2.10<br>The table below contains the