True/False
Given below is the scatter plot of the market value (thousands$)and profit (thousands$)of 50 Australian companies.Higher market values appear to be associated with higher profits. 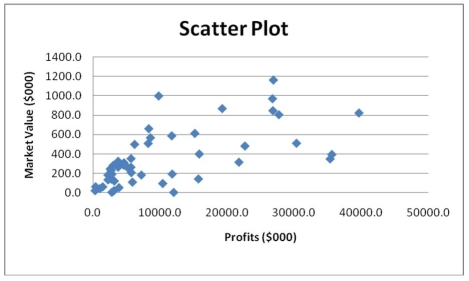
Correct Answer:

Verified
Correct Answer:
Verified
Related Questions
Q36: Instruction 2.8<br>Given below is the stem-and-leaf
Q37: Instruction 2.1<br>An insurance company evaluates many
Q38: Instruction 2.10<br>The table below contains the
Q39: Instruction 2.11<br>The table below contains the
Q40: Figure 2.1<br>Every second semester, the School of
Q42: Sarah is reviewing a report on her
Q43: Instruction 2.6<br>The frequency distribution below represents
Q44: Instruction 2.4<br>The following are the durations
Q45: Instruction 2.9<br>A sample of 200 students
Q46: Instruction 2.10<br>The table below contains the