True/False
Instruction 12.26
The manager of the purchasing department of a large savings and loan organization would like to develop a model to predict the amount of time (measured in hours) it takes to record a loan application. Data are collected from a sample of 30 days, and the number of applications recorded and completion time in hours is recorded. Below is the regression output:
Note: 4.3946E-15 is 4.3946 × 10⁻¹⁵. 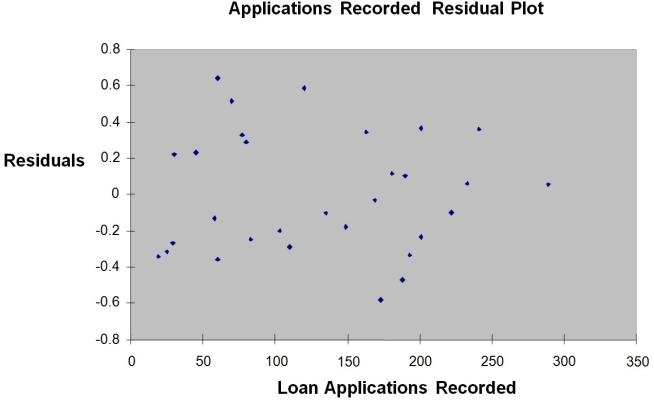
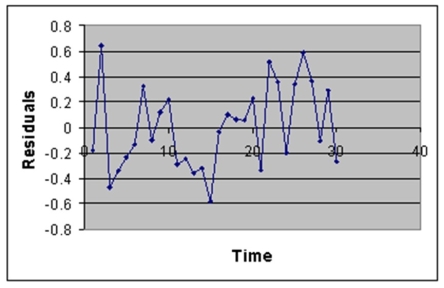
-Referring to Instruction 12.26,there is no evidence of positive autocorrelation if the Durbin-Watson test statistic is found to be 1.78.
Correct Answer:

Verified
Correct Answer:
Verified
Q69: The coefficient of determination represents the ratio
Q158: Instruction 12.18<br>The manager of the purchasing
Q159: The least squares method minimises which of
Q160: Instruction 12.38<br>The director of cooperative education
Q162: Instruction 12.2<br>A chocolate bar manufacturer is
Q164: Instruction 12.3<br>The director of cooperative education
Q165: Instruction 12.38<br>The director of cooperative education
Q167: Instruction 12.34<br>The management of a chain
Q168: Instruction 12.34<br>The management of a chain
Q181: The sample correlation coefficient between X and