Short Answer
The graph in the figure shows the position of an object as a function of time.The letters H-L represent particular moments of time.At which moments shown (H,I,etc.)is the speed of the object
(a)the greatest?
(b)the smallest? 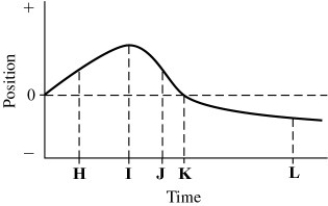
Correct Answer:

Verified
Correct Answer:
Verified
Related Questions
Q1: If the graph of the position as
Q2: The figure shows the position of an
Q3: The position of an object as a
Q5: A rocket takes off vertically from the
Q6: A toy rocket is launched vertically from
Q7: A ball is projected upward at time
Q8: A airplane that is flying level needs
Q9: An object starts its motion with a
Q10: Two objects are thrown from the top
Q11: An object is moving in a straight