Short Answer
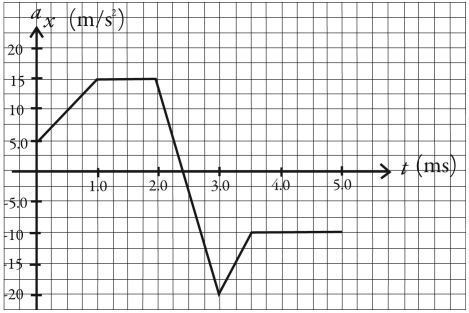
The graph in the figure shows the x component of the acceleration of a 2.4-kg object as a function of time (in ms).  (a)At what time(s)does the x component of the net force on the object reach its maximum magnitude,and what is that maximum magnitude?
(b)What is the x component of the net force on the object at time  and at
  ?
?
Correct Answer:

Verified
(a)At 3.0 ...View Answer
Unlock this answer now
Get Access to more Verified Answers free of charge
Correct Answer:
Verified
View Answer
Unlock this answer now
Get Access to more Verified Answers free of charge
Q14: A 50.0-N box is sliding on a
Q15: A box of mass m is pulled
Q16: A 10,000-kg rocket blasts off from earth
Q17: An object is moving to the right,and
Q18: On its own,a certain tow-truck has a
Q20: Two forces act on a <img src="https://d2lvgg3v3hfg70.cloudfront.net/TB6394/.jpg"
Q21: The figure shows a graph of the
Q22: An object is moving forward with a
Q23: A block is on a frictionless horizontal
Q24: If a 5.0 kg box is pulled