Essay
The graph in the figure shows the net force acting on a 3.0-kg object as a function of time. 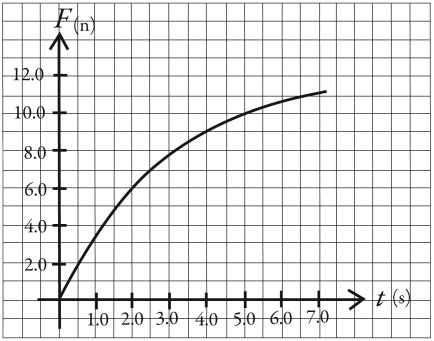 (a)What is the acceleration of this object at time t = 2.0 s?
(b)Draw,to scale,a graph of the acceleration of this object as a function of time over the range  to
to  .
.
Correct Answer:

Verified
(a)2.0 m/s2
(b)The acceleration...View Answer
Unlock this answer now
Get Access to more Verified Answers free of charge
Correct Answer:
Verified
(b)The acceleration...
View Answer
Unlock this answer now
Get Access to more Verified Answers free of charge
Q3: You swing a bat and hit a
Q4: Two objects,each of weight W,hang vertically by
Q5: A series of weights connected by very
Q6: You are seated in a bus and
Q7: Point P in the figure indicates the
Q9: The following four forces act on a
Q10: A 1000-kg car is driving toward the
Q11: A box of mass 50 kg is
Q12: Suppose you are playing hockey on a
Q13: On a horizontal frictionless floor,a worker of