Multiple Choice
Figure 2.2 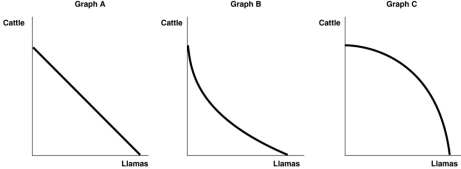
-Refer to Figure 2.2.Steve Vignetto raises cattle and llamas on his land.A portion of his land is more suitable for raising cattle, and the other portion is better suited for raising llamas.Which of the graphs in Figure 2-2 represents his production possibility frontier?
A) Graph A.
B) Graph B.
C) Graph C.
D) Either Graph B or Graph C.
Correct Answer:

Verified
Correct Answer:
Verified
Q78: What is the difference between product markets
Q111: In which market are the natural resources
Q113: The Great Depression of the 1930s, with
Q114: Figure 2.3 <img src="https://d2lvgg3v3hfg70.cloudfront.net/TB1015/.jpg" alt="Figure 2.3
Q119: Table 2.7 <img src="https://d2lvgg3v3hfg70.cloudfront.net/TB1015/.jpg" alt="Table 2.7
Q120: Jane can bake either a combination of
Q145: Table 2.8<br> <img src="https://d2lvgg3v3hfg70.cloudfront.net/TB3087/.jpg" alt="Table 2.8
Q159: Table 2.7<br> <img src="https://d2lvgg3v3hfg70.cloudfront.net/TB3087/.jpg" alt="Table 2.7
Q233: Stricter laws and regulations to protect intellectual
Q246: In a free market there are virtually