Multiple Choice
Figure 9.8 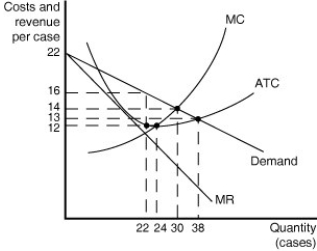 Figure 9.8 shows cost and demand curves for a monopolistically competitive producer of iced tea.
-Refer to Figure 9.8.Based on the diagram,one can conclude that _______.
A) some existing firms will exit the market
B) new firms will enter the market
C) the industry is in long-run equilibrium
D) firms achieve productive efficiency
Correct Answer:

Verified
Correct Answer:
Verified
Q5: Table 9.3 <img src="https://d2lvgg3v3hfg70.cloudfront.net/TB6606/.jpg" alt="Table 9.3
Q11: Figure 9.8 <img src="https://d2lvgg3v3hfg70.cloudfront.net/TB6606/.jpg" alt="Figure 9.8
Q45: Suppose we want to use game theory
Q48: What one good thing happens when a
Q81: New firms are able to enter monopolistically
Q87: Which of the following is not part
Q137: One reason why the coffeehouse market is
Q141: For the monopolistically competitive firm,<br>A)Price (P)= Marginal
Q168: Which of the following is an example
Q253: In long-run equilibrium, compared to a perfectly