Short Answer
The graph in the figure shows the position of a particle as a function of time as it travels along the x-axis.
(a)What is the average speed of the particle between t = 2.0 s and t = 4.0 s?
(b)What is the average velocity of the particle between t = 2.0 s and t = 4.0 s? 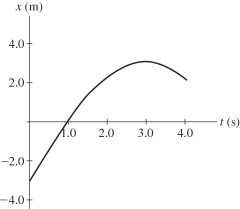
Correct Answer:

Verified
(a)1.0 m/s...View Answer
Unlock this answer now
Get Access to more Verified Answers free of charge
Correct Answer:
Verified
View Answer
Unlock this answer now
Get Access to more Verified Answers free of charge
Q27: An auto manufacturer advertises that their car
Q51: An object is moving with constant non-zero
Q53: An astronaut stands by the rim of
Q93: A car is moving with a constant
Q118: A baseball is hit with a bat
Q142: A ball is thrown downward in the
Q143: A car with good tires on a
Q149: A cart has an initial velocity of
Q151: Assuming equal rates of uniform acceleration
Q152: A ball is thrown straight upward from