Short Answer
The graph in the figure shows the position of a particle as a function of time as it travels along the x-axis.
(a)What is the magnitude of the average velocity of the particle between t = 1.0 s and t = 4.0 s?
(b)What is the average speed of the particle between t = 1.0 s and t = 4.0 s? 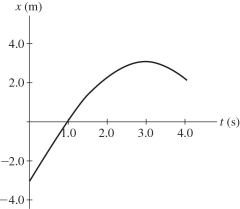
Correct Answer:

Verified
(a)0.67 m/...View Answer
Unlock this answer now
Get Access to more Verified Answers free of charge
Correct Answer:
Verified
View Answer
Unlock this answer now
Get Access to more Verified Answers free of charge
Q23: Which of the following quantities has units
Q26: You are driving home on a weekend
Q33: The slope of a position versus time
Q64: If the velocity of an object is
Q81: To determine the height of a bridge
Q132: If the velocity versus time graph of
Q134: A racing car accelerates uniformly from rest
Q141: A rock is thrown upward with a
Q142: A ball is thrown downward in the
Q512: If the position versus time graph of