Multiple Choice
The graph in the figure shows the velocity of a particle as it travels along the x-axis.What is the magnitude of the average acceleration of the particle between t = 1.0 s and t = 4.0 s? 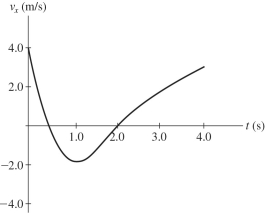
A) 0.33 m/s2
B) 1.7 m/s2
C) 2.0 m/s2
D) 2.5 m/s2
E) 3.0 m/s2
Correct Answer:

Verified
Correct Answer:
Verified
Related Questions
Q22: A polar bear starts at the North
Q48: An object is moving with constant non-zero
Q91: A car starting from rest accelerates at
Q110: A ball is thrown upward at a
Q112: Acceleration is sometimes expressed in multiples
Q118: The motion of a particle is described
Q119: A rock is thrown upward with a
Q120: An airplane needs to reach a
Q127: Starting from rest,a dragster travels a straight
Q470: If you run a complete loop around