Multiple Choice
The figure shows a graph of the velocity of an object as a function of time.What is the displacement of the object from 0 s to 8.0 s? 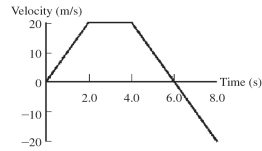
A) 20 m
B) 40 m
C) 60 m
D) 80 m
E) 100 m
Correct Answer:

Verified
Correct Answer:
Verified
Related Questions
Q15: A rock is thrown upward with a
Q16: A ball is thrown downward from the
Q19: A foul ball is hit straight up
Q22: Which of the following graphs represent an
Q24: The figure shows a graph of the
Q34: Under what condition is average velocity equal
Q37: An object is dropped from a bridge.A
Q39: A motorist travels 160 km at 80
Q129: To determine the height of a bridge
Q132: An astronaut stands by the rim of