Multiple Choice
The figure shows a graph of the position x as a function of time t for a system undergoing simple harmonic motion.Which one of the following graphs represents the velocity of this system as a function of time? 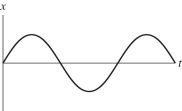 a)
a) 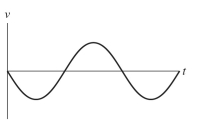
b) 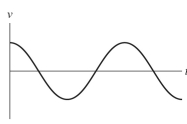
c) 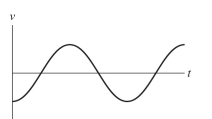
d) 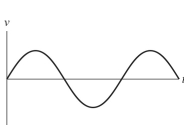
A) graph a
B) graph b
C) graph c
D) graph d
Correct Answer:

Verified
Correct Answer:
Verified
Related Questions
Q55: An air-track cart is attached to a
Q56: A 34-kg child on an 18-kg
Q57: An object is attached to a vertical
Q58: The position of an air-track cart that
Q62: An object attached to a spring undergoes
Q65: A object on a spring undergoes SHM.When
Q70: In simple harmonic motion,when is the magnitude
Q86: A sewing machine needle moves up and
Q96: A sewing machine needle moves in simple
Q107: A point on the string of a