Multiple Choice
The figure shows a graph of the velocity v as a function of time t for a system undergoing simple harmonic motion.Which one of the following graphs represents the acceleration of this system as a function of time? 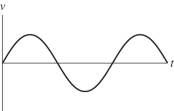 a)
a) 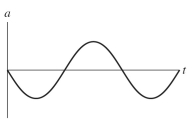
b) 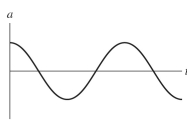
c) 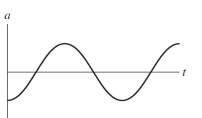
d) 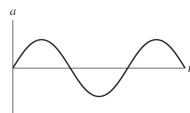
A) graph a
B) graph b
C) graph c
D) graph d
Correct Answer:

Verified
Correct Answer:
Verified
Related Questions
Q3: If your heart is beating at 76.0
Q6: As shown in the figure,a 0.23-kg
Q7: The period of a simple pendulum
Q9: An object attached to an ideal spring
Q12: A 1.15-kg beaker (including its contents)is placed
Q13: If both the mass of a
Q15: A 0.50-kg box is attached to an
Q21: In 1851 Jean Bernard Leon Foucault demonstrated
Q26: Identical balls oscillate with the same period
Q45: A pendulum of length L is suspended