Multiple Choice
The figure shows a graph of the position x as a function of time t for a system undergoing simple harmonic motion.Which one of the following graphs represents the acceleration of this system as a function of time? 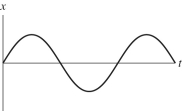 a)
a) 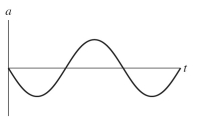
b) 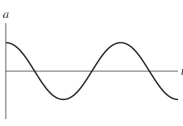
c) 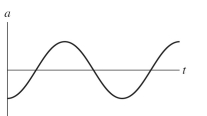
d) 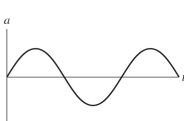
A) graph a
B) graph b
C) graph c
D) graph d
Correct Answer:

Verified
Correct Answer:
Verified
Related Questions
Q6: A 1.53-kg piece of iron is hung
Q32: A pendulum that was originally erected by
Q36: An object is attached to a vertical
Q49: The total mechanical energy of a simple
Q76: The quartz crystal in a digital watch
Q76: An astronaut has landed on Planet N-40
Q76: The equation of motion of a particle
Q77: An object is attached to a vertical
Q84: Grandfather clocks are designed so they can
Q85: Grandfather clocks are designed so they can