Multiple Choice
Use the figure for the question(s) below. 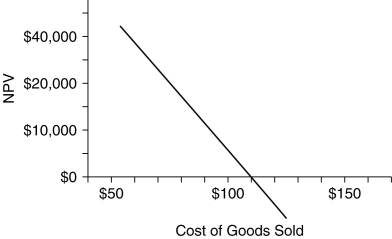
-The graph above shows the break-even analysis for the cost of making a certain good. Based on this chart, which of the following is true?
A) The net present value (NPV) of the project increases with increased cost of goods sold.
B) The project should not be undertaken if the predicted cost of goods sold is less than $110.
C) The net present value (NPV) of the project will be positive if the cost of goods sold is greater than $110.
D) If the good costs $110 to make, the net present value (NPV) of the project will be zero.
Correct Answer:

Verified
Correct Answer:
Verified
Q27: Use the figure for the question(s) below.
Q28: Which of the following costs would you
Q29: <img src="https://d2lvgg3v3hfg70.cloudfront.net/TB1316/.jpg" alt=" A textile company
Q30: Interest and other financing-related expenses are excluded
Q31: You are considering adding a microbrewery onto
Q33: Food For Less (FFL), a grocery store,
Q34: How do we handle interest expense when
Q35: What are the most difficult parts of
Q36: Which of the following best explains why
Q37: A stationery company plans to launch a