Multiple Choice
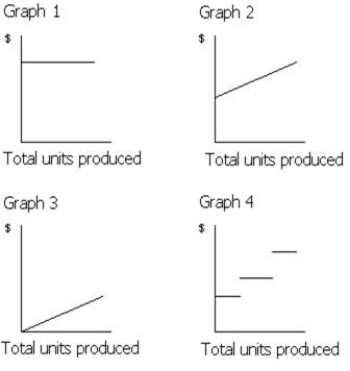
-Which of the graphs in Figure 21-1 illustrates the behavior of a total variable cost?
A) Graph 2
B) Graph 3
C) Graph 4
D) Graph 1
Correct Answer:

Verified
Correct Answer:
Verified
Related Questions
Q1: Dean Company has sales of $500,000, and
Q2: A firm operated at 80% of capacity
Q3: Manley Co. manufactures office furniture. During the
Q4: Direct materials cost that varies with the
Q5: Blane Company has the following data:Total sales$800,000Total
Q7: Which of the following costs is an
Q8: Assuming that last year's fixed costs totaled
Q9: If fixed costs are $561,000 and the
Q10: Because variable costs are assumed to change
Q11: Use this information for Rusty Co. to