Multiple Choice
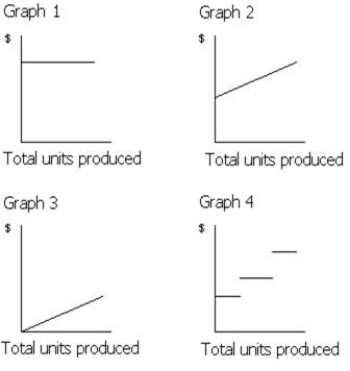
-Which of the graphs in Figure 21-1 illustrates the nature of a mixed cost?
A) Graph 2
B) Graph 3
C) Graph 4
D) Graph 1
Correct Answer:

Verified
Correct Answer:
Verified
Related Questions
Q36: The relevant activity base for a cost
Q37: If a business sells two products, it
Q38: Bryce Co. sales are $914,000, variable costs
Q39: Match the following terms (a-e) with their
Q40: If fixed costs are $450,000, the unit
Q42: Which of the following conditions would cause
Q43: Jacob Inc. has fixed costs of $240,000,
Q44: Consider the following information:?Variable cost per unit
Q45: If variable costs per unit increased because
Q46: Flying Cloud Co. has the following operating