Multiple Choice
Use the following figure to answer the questions :
Figure 7-2 shows the total product curve for different levels of a variable input,labor. 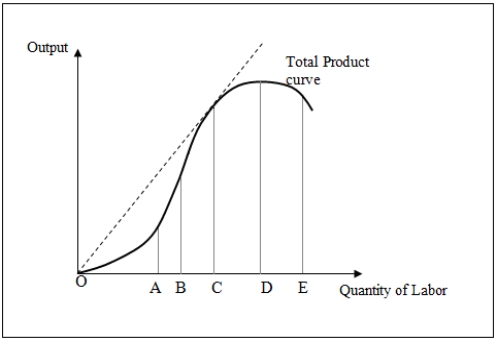
-Let point A be the inflection point.When the quantity of labor employed is between A and D in Figure 7-2:
A) marginal product is negative.
B) marginal product is decreasing.
C) average product is increasing.
D) marginal product is increasing at a decreasing rate.
Correct Answer:

Verified
Correct Answer:
Verified
Q11: Define and then derive the expression for
Q12: The marginal rate of technical substitution equals
Q13: Use the following figure to answer the
Q14: Use the following table to answer the
Q15: A production function for widgets will _.<br>A)show
Q17: Table 7.1 shows the quantities of labor
Q18: Use the following table to answer the
Q19: What is meant by technological efficiency in
Q20: Table 7-3 shows the combinations of labor
Q21: What can you conclude about an isoquant