Multiple Choice
Use the following figure to answer the questions :
Figure 7-2 shows the total product curve for different levels of a variable input,labor. 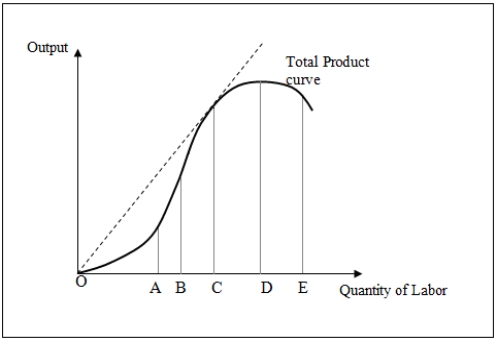
-When the labor input employed in production is between points O and C in Figure 7-2:
A) average product reaches a minimum.
B) marginal product reaches a maximum.
C) marginal product is below average product.
D) total product first increases at a decreasing rate and then increases at an increasing rate.
Correct Answer:

Verified
Correct Answer:
Verified
Q102: All of the following give rise to
Q103: Graphically,the _ indicates whether returns to scale
Q104: Which of the following is true of
Q105: In a Cobb-Douglas production function,the law of
Q106: Convexity of a curve implies that the
Q108: A production function that exhibits constant returns
Q109: If total product is increasing at a
Q110: A production isoquant identifies _.<br>A)the maximum output
Q111: Use the following table to answer the
Q112: If a firm doubles its usage of