Multiple Choice
Use the following figure to answer the questions :
Figure 7-2 shows the total product curve for different levels of a variable input,labor. 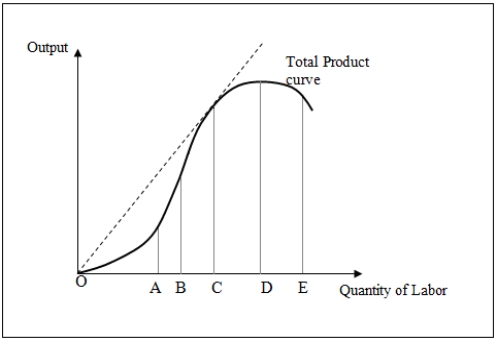
-When the quantity of labor employed lies between points D and E in Figure 7-2:
A) marginal product reaches a maximum and then declines.
B) marginal product reaches a maximum and then becomes negative.
C) total product is increasing at a decreasing rate.
D) total product is decreasing.
Correct Answer:

Verified
Correct Answer:
Verified
Q94: One important difference between indifference curves and
Q95: Use the following figure to answer the
Q96: With capital (K)on the vertical axis and
Q97: When the total product curve with only
Q98: A carpenter hammers nails each day at
Q100: For the following total product curves [TP<sub>1</sub>
Q101: A carpenter hammers nails each day at
Q102: All of the following give rise to
Q103: Graphically,the _ indicates whether returns to scale
Q104: Which of the following is true of