Multiple Choice
Use the following figure to answer the question : figure 8-1: shows the curves F,C,and G denote the total cost,the total variable cost,and the total fixed cost of a firm.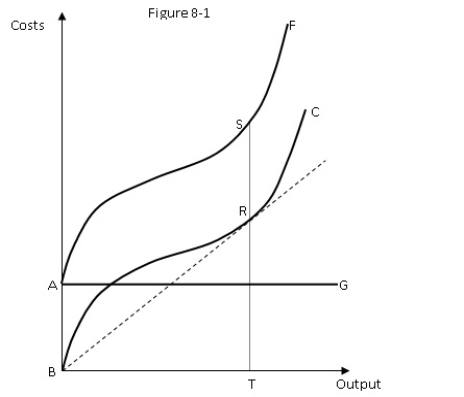
-In Figure 8-1,which of the following distances represent the total cost of producing BT units of output?
A) SR
B) ST
C) RT
D) AB
Correct Answer:

Verified
Correct Answer:
Verified
Q29: Which of the following statements about the
Q30: Suppose labor is on the horizontal axis
Q31: If total fixed costs are $1,000,variable costs
Q32: At 20 units of output,the slope of
Q33: When output expands from the fourth to
Q35: Using an isoquant and isocost curves,with labor
Q36: Ben decides to expand his ice cream
Q37: The minimum efficient scale is:<br>A)the level of
Q38: If total cost rises as the level
Q39: Economic analysis suggests that if the marginal