Multiple Choice
The following figure shows the effect of a price ceiling in the market for yams.The market was initially in equilibrium at price P2 and quantity B. 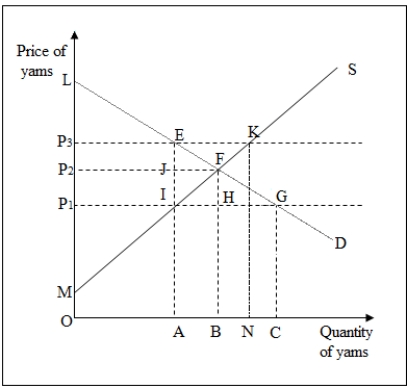 Refer to Figure 10-1.The total surplus at the initial point of equilibrium,F,is given by _____.
A) LFP2
B) LFGP1
C) LFM
D) LFIP1
Correct Answer:

Verified
Correct Answer:
Verified
Q58: Use the following figure to answer the
Q59: The equilibrium of a competitive industry is:<br>A)equitable
Q60: An excise tax imposed on junk food
Q61: When a price ceiling is imposed in
Q62: Given that quotas benefit producers,who are few
Q64: An excise tax levied on firms in
Q65: Is the outcome of a competitive market
Q66: Which of the following strengthens the possibility
Q67: How do price ceilings in the rental
Q68: A contestable market is one in which:<br>A)a