Multiple Choice
Use the following figure to answer the question : Figure 13-1 : shows the Stackelberg model of a duopoly.Both firms face constant marginal costs equal to OJ and the market demand curve is AD.The Stackelberg firm produces an output of OF and OF is equal to FL. 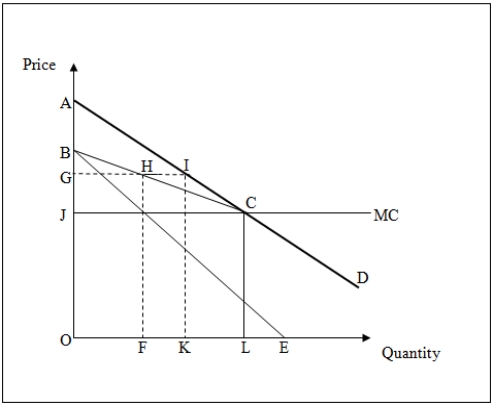
-Refer to Figure 13-1.The difference between the total industry output produced under a perfect competition model and a Stackelberg model is represented by the distance _____.
A) KF
B) KL
C) LE
D) FL
Correct Answer:

Verified
Correct Answer:
Verified
Q84: Which of the following conditions holds for
Q85: Use the following figure to answer the
Q86: Consider a dominant firm model in which
Q87: The Stackelberg model is different from the
Q88: Which of the following is true of
Q90: The demand curve that a monopolistically competitive
Q91: Given that OPEC [Organization of the Petroleum
Q92: ABC Inc. ,is a leading consumer goods
Q93: Government intervention in monopolistically competitive industries is
Q94: Which of the following is not true