Multiple Choice
The table given below represents the payoff matrix of firms A and B,when they choose to produce low or high output.In each cell,the figure on the left indicates Firm B's payoffs and the figure on the right indicates Firm A's payoffs.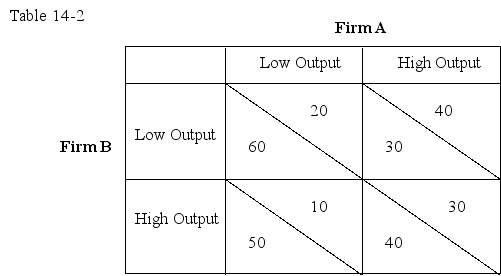
The information in Table 14-2 implies that the game has:
A) a Nash equilibrium and a dominant-strategy equilibrium.
B) a Nash equilibrium but not a dominant-strategy equilibrium.
C) no Nash equilibrium but has a dominant-strategy equilibrium.
D) neither a Nash equilibrium nor a dominant-strategy equilibrium.
Correct Answer:

Verified
Correct Answer:
Verified
Q17: The table given below shows the payoffs
Q18: Under which of the following game theory
Q19: Which of the following is true of
Q20: Bella,a dentist,purchases a new sedan worth $25,000
Q21: Use the following table to answer the
Q23: Which of the following oligopoly models has
Q24: Which of the following,if true,would allow oligopolists
Q25: A prisoner's dilemma equilibrium is:<br>A)identical to the
Q26: Use the following table to answer the
Q27: A buildup of nuclear weapons between two