Multiple Choice
The table given below represents the payoff matrix of firms A and B,when they choose to produce either high output or low output.In each cell,the figure on the left indicates Firm B's payoffs and the figure on the right indicates Firm A's payoffs.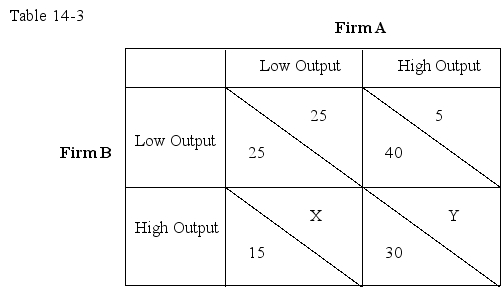
If X = 10 and Y = 15,then which of the following conclusions can be drawn from the information given in Table 14-3?
A) The game has a Nash equilibrium and a dominant-strategy equilibrium.
B) The game has a Nash equilibrium but not a dominant-strategy equilibrium.
C) The game does not have a Nash equilibrium but has a dominant-strategy equilibrium.
D) The game has neither a Nash equilibrium nor a dominant-strategy equilibrium.
Correct Answer:

Verified
Correct Answer:
Verified
Q75: Moral hazard describes a situation in which:<br>A)the
Q76: Use the following table to answer the
Q77: Game theory is a method of analyzing:<br>A)the
Q78: Which of the following is true for
Q79: People are not always fully informed about
Q81: What is a prisoner's dilemma? Draw a
Q82: In an oligopoly game,the greater the number
Q83: Advertising is profitable for a firm when:<br>A)it
Q84: Karen hires a carpenter from a firm
Q85: To avoid getting a "lemon" house,buyers hire