Multiple Choice
The table given below represents the payoff matrix of firms A and B,when they choose to produce either high output or low output.In each cell,the figure on the left indicates Firm B's payoffs and the figure on the right indicates Firm A's payoffs.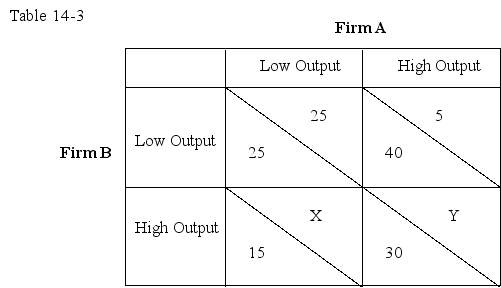
If X = 10 and Y = 15,then from the information in Table 14-3 we can say that:
A) the payoff matrix represents a prisoner's dilemma game.
B) the game has a dominant-strategy equilibrium.
C) the game has a Nash equilibrium.
D) the payoff matrix represents a Cournot oligopoly.
Correct Answer:

Verified
Correct Answer:
Verified
Q67: Which of the following is likely to
Q68: Which of the following practices allows insurance
Q69: Empirical analysis with respect to the used
Q70: Which of the following is likely to
Q71: The view that advertising serves as a
Q73: Adverse selection describes a situation in which:<br>A)the
Q74: Asymmetric information describes a situation in which:<br>A)both
Q75: Moral hazard describes a situation in which:<br>A)the
Q76: Use the following table to answer the
Q77: Game theory is a method of analyzing:<br>A)the