Multiple Choice
Use the following figure to answer the question : Figure 18-2 :
shows the demand and supply curves of labor.A per-unit tax imposed on the wage income of the employees shifts the supply curve of labor upward. 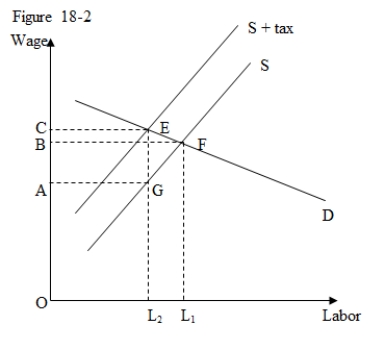
-Refer to Figure 18-2.The total revenue collected by the government from the per-unit tax is represented by the area:
A) BFL1O.
B) CEL2O.
C) ABFG.
D) ACEG.
Correct Answer:

Verified
Correct Answer:
Verified
Q73: Which of the following factors hinders the
Q74: If the current Social Security system in
Q75: Which of the following explains why immigration
Q76: For a firm that operates in an
Q77: Empirical evidence suggests that a large majority
Q79: A recent study investigating discrimination in hiring
Q80: Which of the following is most likely
Q81: A minimum wage mandated by the government
Q82: Which of the following categories of workers
Q83: When the supply curve of labor is