Multiple Choice
Use the following figure to answer the question : Figure 19-1 :
,the curve TT shows how the allocation of a resource affects the well-being of two individuals,Hank and Monica. 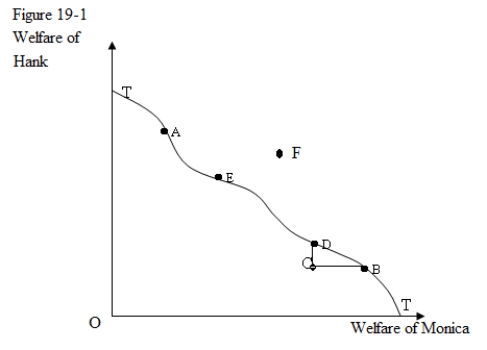
-In Figure 19-1,TT is referred to as:
A) the welfare frontier.
B) the production possibility frontier.
C) the marginal rate of transformation curve.
D) the community indifference curve.
Correct Answer:

Verified
Correct Answer:
Verified
Q37: An existing allocation of goods is said
Q38: If the labor market is perfectly competitive:<br>A)the
Q39: A typical consumer consumes products X and
Q40: In a general competitive equilibrium,the slope of
Q41: If the marginal rates of technical substitution
Q43: The marginal rate of transformation measures the:<br>A)absolute
Q44: When the allocation of two goods between
Q45: Which of the following statements about the
Q46: A change in equilibrium in one market
Q47: A general competitive equilibrium:<br>A)must lie on the