Multiple Choice
Use the following figure to answer the question : Figure 19-1 :
,the curve TT shows how the allocation of a resource affects the well-being of two individuals,Hank and Monica. 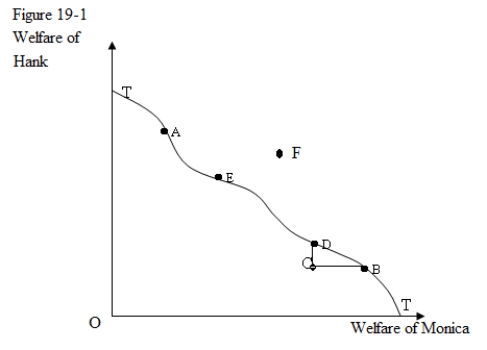
-In Figure 19-1,a move from C to D would:
A) be desirable because it produces a more equal distribution of resources.
B) be more desirable than a movement from C to B.
C) be desirable because a movement from an inefficient allocation of resources to an efficient allocation of resources is always preferred.
D) represent a movement from an inefficient allocation to an efficient allocation of resources.
Correct Answer:

Verified
Correct Answer:
Verified
Q65: In the absence of trade between a
Q66: If the marginal rates of technical substitution
Q67: What is the difference between partial and
Q68: A general competitive equilibrium in input markets:<br>A)is
Q69: General equilibrium analysis is the study of:<br>A)how
Q71: The rate at which one product can
Q72: A point off the contract curve in
Q73: Assuming that Good X and Good Y
Q74: An allocation of resources is inefficient if,through
Q75: The production possibility frontier [PPF] is derived