Multiple Choice
Use the following figure to answer the question : Figure 19-1 :
,the curve TT shows how the allocation of a resource affects the well-being of two individuals,Hank and Monica. 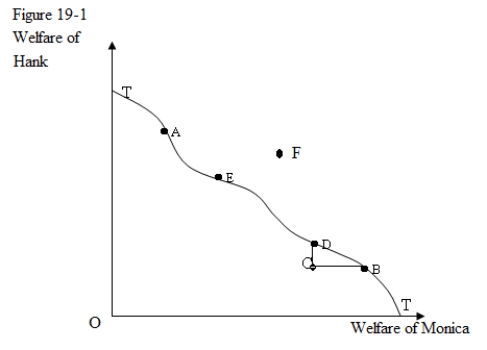
-In Figure 19-1,point F represents a resource allocation that is:
A) is feasible but undesirable from the society's point of view.
B) inefficient.
C) desirable but not attainable.
D) both undesirable and unattainable.
Correct Answer:

Verified
Correct Answer:
Verified
Q4: Which of the following is true of
Q5: Explain why economic efficiency cannot be achieved
Q6: Use the following figure to answer the
Q7: A perfectly competitive economy generally results in
Q8: If there is a monopoly in the
Q10: Figure 19-3 illustrates the determination of an
Q11: Which of the following is not one
Q12: Use the following figure to answer the
Q13: Two goods are said to be allocated
Q14: In which of the following situations would