Multiple Choice
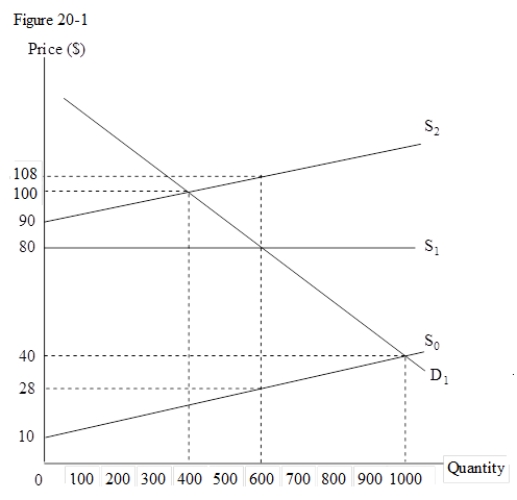
Use the following figure to answer the question : Figure 20-1 : D1 and S1 are the private demand and supply curves,of a commodity produced by a competitive firm.S2 reflects the social marginal cost of production,while S0 represents the external marginal cost. 
-Refer to Figure 20-1.A comparison between the efficient outcome and the market equilibrium reveals that:
A) the price level when the outcome is efficient is higher than the price at the market equilibrium by $30.
B) the price level when the outcome is efficient is lower than the price at the market equilibrium by $10.
C) the price level when the outcome is efficient is lower than the price at the market equilibrium by $40.
D) the price level when the outcome is efficient is higher than the price at the market equilibrium by $20.
Correct Answer:

Verified
Correct Answer:
Verified
Q73: Which of the following activities entails an
Q74: The combined or market demand curve for
Q75: A congested,toll road is characterized by:<br>A)nonexclusion and
Q76: The cost imposed by an economic activity
Q77: Which of the following is true of
Q79: When do externalities arise?<br>A)When the explicit costs
Q80: Perfect competition in an industry ensures:<br>A)both production
Q81: For which of the following goods will
Q82: Perfect competition ensures efficiency in industry output
Q83: The free-rider problem occurs because:<br>a.it is easy