Multiple Choice
Use the following figure to answer the question : Figure 20-2 : shows the competitive supply curve of a commodity is given by S1,the private marginal benefit curve is D1,the marginal social benefit curve is D2,and the MBE curve reflects the marginal external benefits. 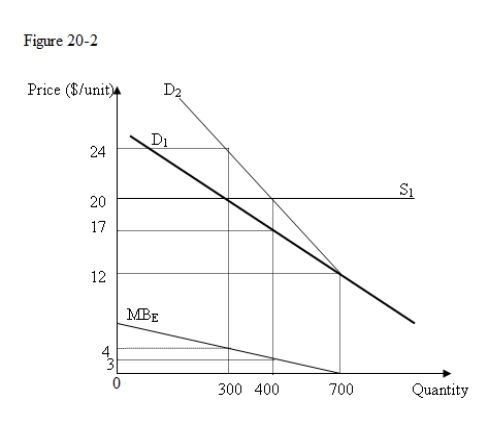
-In Figure 20-2,the price level when the efficient output is being produced is _____ than the price level when the market equilibrium output is being produced by _____.
A) less;$8
B) more;$4
C) less;$3
D) more;$3
Correct Answer:

Verified
Correct Answer:
Verified
Q41: Taxes imposed on polluting firms,for internalizing the
Q42: Suppose that an economy has four people,A,B,C,and
Q43: Use the following figure to answer the
Q44: Explain with the help of a suitable
Q45: The social cost of producing a commodity
Q47: Use the following figure to answer the
Q48: Which of the following statements is true
Q49: When the entire costs and benefits of
Q50: Suppose that an economy has four people,A,B,C,and
Q51: Which of the following helps to achieve