Multiple Choice
Use the following figure to answer the question : Figure 20-2 : shows the competitive supply curve of a commodity is given by S1,the private marginal benefit curve is D1,the marginal social benefit curve is D2,and the MBE curve reflects the marginal external benefits. 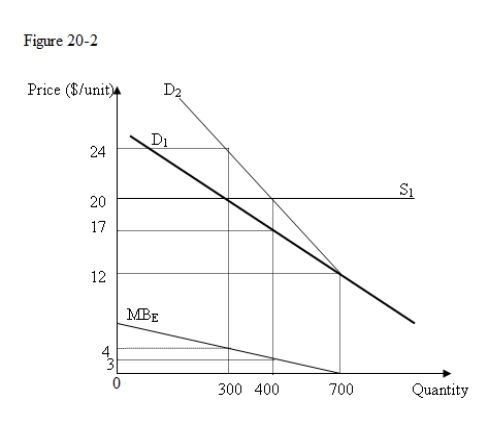
-From Figure 20-2,we can conclude that to help the market attain the efficient level of output,the government should:
A) provide a subsidy of $8 per unit to the producer.
B) impose a tax of $4 per unit of production.
C) provide a subsidy of $3 per unit to the producer.
D) impose a tax of $3 per unit of production.
Correct Answer:

Verified
Correct Answer:
Verified
Q57: A tax used to internalize an external
Q58: Tradable pollution permits achieve a given emission
Q59: Use the following figure to answer the
Q60: Which of the following is an example
Q61: Which of the following is true with
Q63: Which of the following categories of goods
Q64: The Coase theorem states that when transaction
Q65: The severity of the free rider problem
Q66: Competitive markets are unlikely to produce the
Q67: Assume that the economy of Wonderland has