Multiple Choice
? 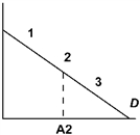
In the picture above the point A2 is half way between the origin and the quantity intercept of the demand curve. The price elasticity at point "2" is
A) 0
B) between -? and -1
C) -1
D) between -1 and 0
Correct Answer:

Verified
Correct Answer:
Verified
Related Questions
Q35: If a good is Giffen and its
Q36: Demand functions are "homogeneous of degree zero
Q37: ? <img src="https://d2lvgg3v3hfg70.cloudfront.net/TB2264/.jpg" alt="? ?In
Q38: If the prices of all goods increase
Q39: If there are only two goods and
Q41: If a consumer purchases only two goods
Q42: If the income elasticity of demand is
Q43: The demand for gasoline is more elastic
Q44: A change in the distribution of income
Q45: If the income elasticity of demand is