Short Answer
What type of relationship is depicted in the following scatter diagram? 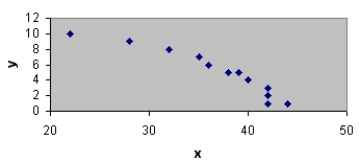
Correct Answer:

Verified
A negative...View Answer
Unlock this answer now
Get Access to more Verified Answers free of charge
Correct Answer:
Verified
A negative...
View Answer
Unlock this answer now
Get Access to more Verified Answers free of charge
Related Questions
Q5: When using Excel to create a _,
Q24: Exhibit 2-1<br>The numbers of hours worked (per
Q46: Fifteen percent of the students in a
Q58: To construct a pie chart using Excel's
Q90: What type of relationship is depicted in
Q91: Exhibit 2-4<br>A survey of 400 college seniors
Q93: A frequency distribution is<br>A)a tabular summary of
Q95: If several frequency distributions are constructed from
Q96: You are given the following data on
Q98: Exhibit 2-4<br>A survey of 400 college seniors