Essay
Guests staying at Marada Inn were asked to rate the quality of their accommodations as being excellent, above average, average, below average, or poor. The ratings provided by a sample of 20 quests are shown below. 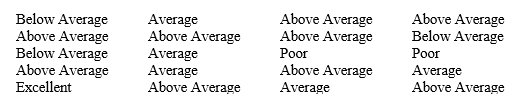
a. Provide a frequency distribution showing the number of occurrences of each rating level in the sample.
b. Construct relative frequency and percent frequency distributions for the data.
c. Display the frequencies graphically with a bar graph.
d. Display the percent frequencies graphically with a pie chart.
Correct Answer:

Verified
Correct Answer:
Verified
Q6: Which of the following graphical methods is
Q8: Exhibit 2-1<br>The numbers of hours worked (per
Q19: The sum of frequencies for all classes
Q20: Categorical data can be graphically represented by
Q35: For stem-and-leaf displays where the leaf unit
Q52: Excel's _ can be used to construct
Q56: Exhibit 2-3<br>The number of sick days taken
Q59: Exhibit 2-2<br>Information on the type of industry
Q62: Fill in the missing value for the
Q69: Data that provide labels or names for