Essay
The manager of Hudson Auto Repair would like to get a better picture of the distribution of costs for new parts used in the engine tune-up jobs done in the garage. A sample of 50 customer invoices for tune-ups has been taken and the costs of parts, rounded to the nearest dollar, are listed below. 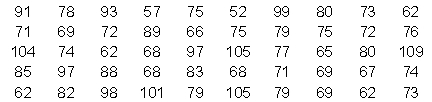 Develop a frequency distribution for these cost data. Use your own judgment to determine the number of classes and class width that provide a distribution that will be meaningful and helpful to the manager.
a. Develop a stem-and-leaf display showing both the rank order and shape of the data set.
b. Develop a stretched stem-and-leaf display using two stems for each leading digit(s).
c. Which display is better at revealing the natural grouping and variation in the data?
Correct Answer:

Verified
a. Stem-and-leaf  b. Stretched...
View Answer
Unlock this answer now
Get Access to more Verified Answers free of charge
Correct Answer:
Verified
View Answer
Unlock this answer now
Get Access to more Verified Answers free of charge
Q7: In constructing a frequency distribution, as the
Q8: Exhibit 2-1<br>The numbers of hours worked (per
Q12: The sum of the percent frequencies for
Q20: Categorical data can be graphically represented by
Q44: For the following observations, plot a scatter
Q45: Exhibit 2-1<br>The numbers of hours worked (per
Q46: Exhibit 2-1<br>The numbers of hours worked (per
Q48: You are given the following data on
Q51: Exhibit 2-1<br>The numbers of hours worked (per
Q52: Excel's _ can be used to construct