Essay
Tony Zamora, a real estate investor, has just moved to Clarksville and wants to learn about the local real estate market. He wants to understand, for example, the relationship between geographical segment of the city and selling price of a house, the relationship between selling price and number of bedrooms, and so on. Tony has randomly selected 25 house-for-sale listings from the Sunday newspaper and collected the data listed below. 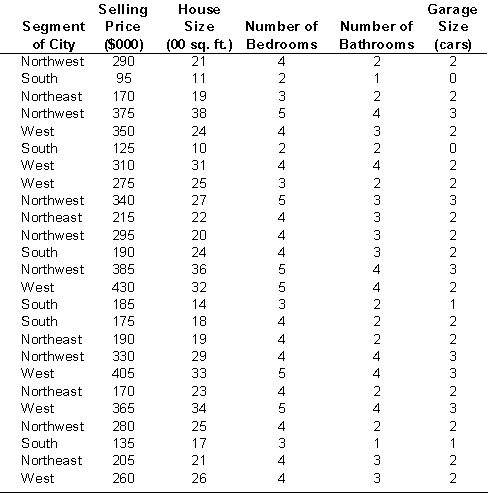
a. Construct a crosstabulation for the variables segment of city and number of bedrooms.
b. Compute the row percentages for your crosstabulation in part (a).
c. Comment on any apparent relationship between the variables.
Correct Answer:

Verified
a. CROSSTABULATION  b. ROW PER...
View Answer
Unlock this answer now
Get Access to more Verified Answers free of charge
Correct Answer:
Verified
View Answer
Unlock this answer now
Get Access to more Verified Answers free of charge
Q1: To construct a bar chart using Excel's
Q15: A common graphical display of quantitative data
Q16: What type of relationship is depicted in
Q17: You are given the following data on
Q19: Exhibit 2-2<br>Information on the type of industry
Q21: Excel's _ can be used to construct
Q22: You are given the following data on
Q23: The sum of the relative frequencies in
Q25: A graphical device for depicting categorical data
Q25: Exhibit 2-3<br>The number of sick days taken