Multiple Choice
The following diagram is a cost-volume-profit graph for a manufacturing company: The difference between line AB and line AC (area BAC) is the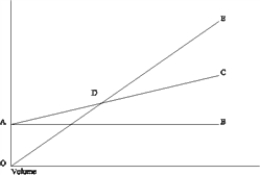
A) contribution ratio.
B) total variable cost.
C) contribution margin per unit.
D) total fixed cost.
Correct Answer:

Verified
Correct Answer:
Verified
Q25: Assuming all other things are the same,
Q50: In a profit-volume graph, the slope of
Q77: Sarah Smith, a sole proprietor, has the
Q79: In 2004, Angel's Bath and Body Shop
Q80: Determine the following missing amounts:<br> <img src="https://d2lvgg3v3hfg70.cloudfront.net/TB3532/.jpg"
Q81: The income statement for Thomas Manufacturing Company
Q84: Assume the following information: What volume of
Q85: The income statement for Thomas Manufacturing Company
Q86: Thomas Company had the following information: Suppose
Q87: Thomas Company had the following information: How